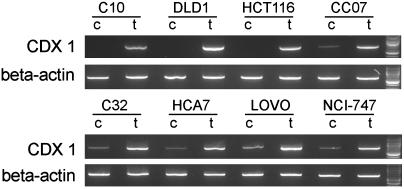
Fig. 2.
5aza2 treatment experiments on eight colorectal carcinoma cell lines. Treated (t) and corresponding control (c) samples are shown for each cell line. The gels show CDX1 mRNA expression as assessed with RT-PCR along with β-actin loading controls for each template. One hundred-base pair ladders (the Upper and Lower bright bands represent 1 kb and 500 bp, respectively) are also shown.

