Fig. 3.
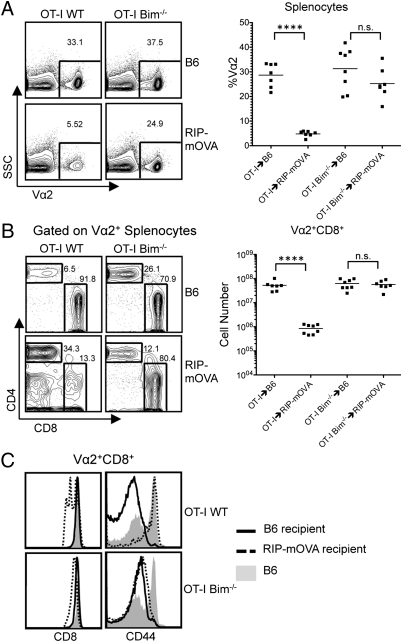
TRA-specific T cells persist in the periphery in the absence of Bim. (A) SSC by Vα2 profile of splenocytes from indicated strains. OT-I→B6 (n = 7), OT-I→RIP-mOVA (n = 8), OT-I Bim−/−→B6 (n = 8), and OT-I Bim−/−→RIP-mOVA (n = 7) and percentage of Vα2+ splenocytes from indicated strains. (B) CD4 by CD8 profile of Vα2+ splenocytes from indicated strains and Vα2+ CD8+ cell numbers from indicated strains. (C) CD8 and CD44 expression of Vα2+ CD8+ T cells from indicated strains. Data are representative of at least five mice from each strain over four independent experiments. ****P ≤ 0.0001. NS, no significance.

