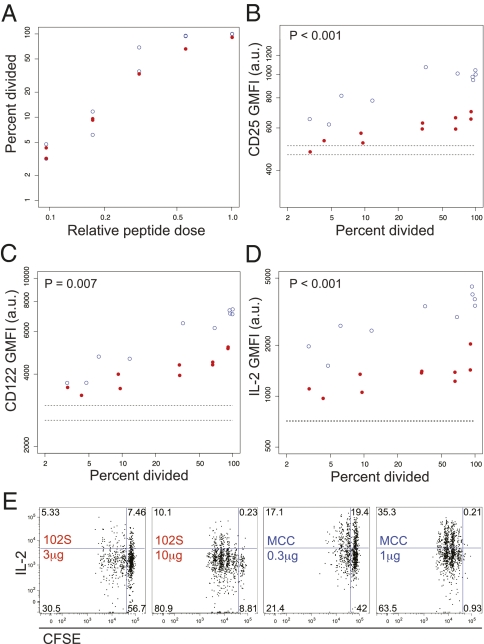
Fig. 3.
The affinity of TCR/pMHC interactions determines IL-2 and IL-2 receptor expression levels. (A) 5C.C7 division was assessed using dilution of CFSE 48 h after injection of doses ranging from 0.1 to 1 μg for MCC and 1 to 10 μg for 102S. The threshold ratio is the ratio of 1 μg for MCC and 10 μg for 102S. Samples from A were analyzed for (B and C) total CD25 and CD122 directly ex vivo or (D and E) IL-2 postrestimulation, compared with percentage of cells divided. Dashed lines (B–D) indicate the position of no-peptide controls. P values compare CD25, CD122, or IL-2 values between groups. Data are representative of at least three experiments.

