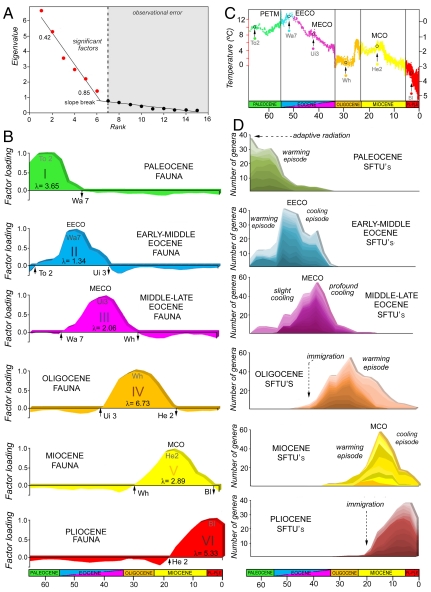
Fig. 1.
Summary of the Q-mode factor analysis performed on the large Cenozoic terrestrial mammals of North America. (A) Bivariate plot of the eigenvalues against their rank for the first 15 factors. (B) Factor loadings of each time interval within the first six rotated factors plotted against geologic time showing their distribution through the Cenozoic. Factors are reordered into temporal sequence. The importance of each rotated factor is denoted by its relative eigenvalue (λ). (C) Stacked deep-sea benthic foraminiferal oxygen isotope values (y axis) on geologic time in Ma (x axis) used as a proxy for global paleotemperature (4). (D) Diversity curves performed as summed areas of those taxa with scores above more than 1.0 in each fauna (Table 1). Note that the diversity peaks coincide approximately with the peaks of factor loadings of each fauna (see Fig. 1C for time intervals). (PETM, Paleocene-Eocene thermal maximum; EECO, early Eocene climate optimum; MECO, middle Eocene climatic optimum; MCO, Miocene climate optimum; To, Torrejonian; Wa, Wasatchian; Ui, Uintan; Wh, Whitneyan; He, Hemingfordian; Bl, Blancan.)

