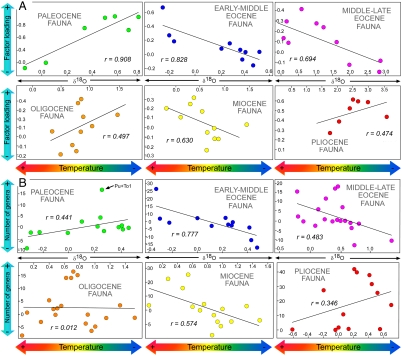
Fig. 2.
Bivariate plots of δ18O isotopic values on the diversity of each mammalian evolutionary fauna. (A) The PFLs of each fauna are used as proxy for faunal diversity. (B) The NG of those SFTUs scoring above 1.0 within each fauna is used as proxy for faunal diversity (see also Fig. 1D and Table 1). Note that both variables have been corrected for serial correlation using GDRA method (SI Text).

