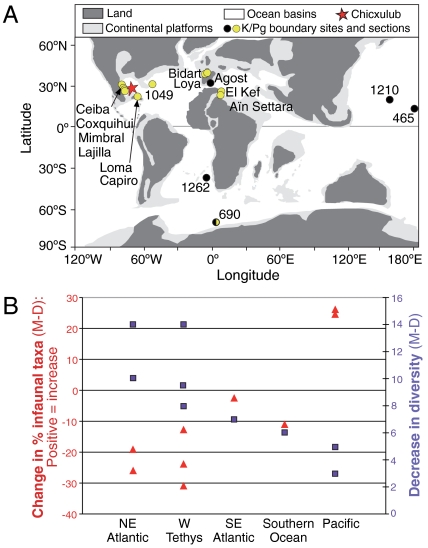
Fig. 1.
Location map and changes in benthic foraminiferal diversity and infaunal morphogroups across the K/Pg boundary. Location of sections and drill sites discussed in the text. (A) Yellow circles indicate a decrease in food flux to the sea floor as estimated from benthic foraminiferal evidence, black circles an increase, and half black circles indicate no significant change. See SI Materials and Methods for construction of map. (B) Blue squares show the decrease in diversity from uppermost Maastrichtian (Cretaceous) to lowermost Danian (Paleogene) for locations shown in A, red triangles show the change in the percentage infaunal taxa, a productivity indicator; data sources are given in SI Materials and Methods.

