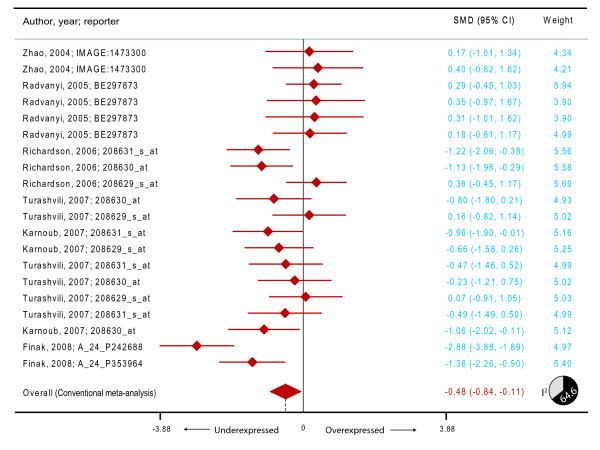
Figure 2.
Meta-analysis of the differential expression of the HADHA gene in breast cancer compared to subjects without breast cancer. The figure shows a forest plot with filled diamonds indicating the point estimates and error bars indicating the 95% confidence interval around the standardized mean difference. The summary effect measure is shown as a filled diamond whose center (dashed vertical line) indicates the point estimate and the width indicates the 95% confidence interval.

