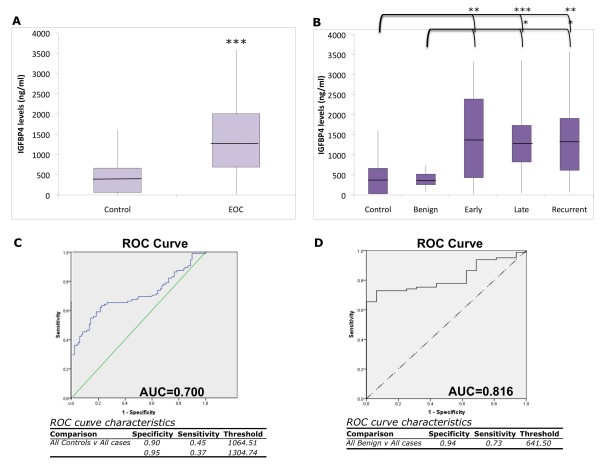
Figure 2.
Serum IGFBP-4 level analysis. (A, B) Box and whisker graphs shows average (central line), quartile levels (top and bottom of box), minimum and maximum (ends of whiskers) IGFBP-4 levels in each group. (A) All controls (healthy and benign) compared to all stages of EOC (***p < 5 × 10⁻⁷). (B) Early, late and recurrent EOC groups have significantly higher IGFBP-4 levels than control or benign groups (*p < 0.05, **p < 0.005). See Table 2 for average values and ranges. Serum IGFBP-4 level ROC analysis of (C) all controls (healthy and benign samples) and all EOC cases (early, late, and recurrent) results in an AUC of 0.700. (D) ROC curve comparing benign controls only to all cases resulted in an AUC of 0.816. Corresponding sensitivity, specificity, and threshold values are listed below each curve.

