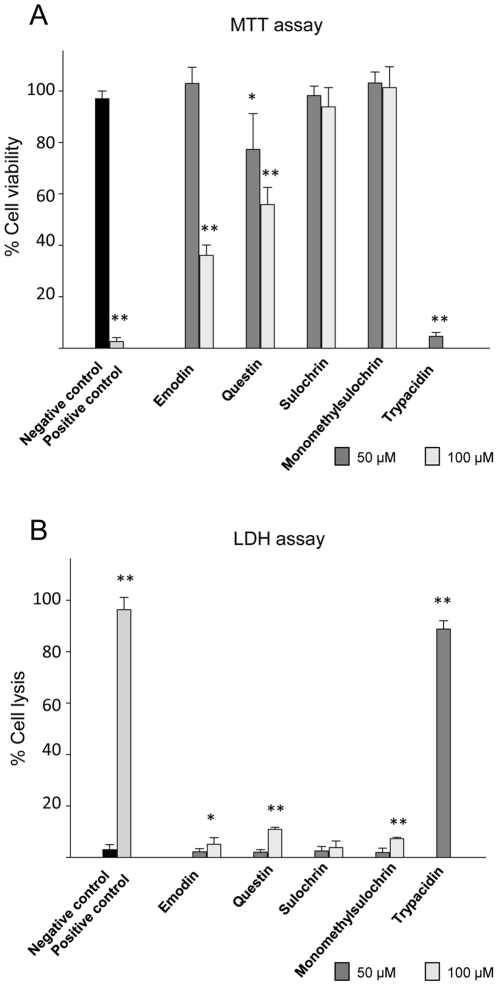
Figure 7. Toxicity effect of the trypacidin pathway metabolites on A549 cells.
Cell viability and cell lysis were measured using respectively MTT and LDH assay. The cells were exposed for 24 h in culture conditions to each metabolite before measuring cell viability and cell lysis as described in the Materials and Methods. The graph shows the mean values of three independent experiments, excepted for trypacidin for which five experiments were carried out. Negative and positive control corresponds respectively to 1% DMSO and gliotoxin (10 µM for MTT assay and 50 µM for LDH assay). Trypacidin was tested at 50 µM and the other metabolites at 50 and 100 µM. Significant difference from the negative control was analysed with the t-test (* for p<0.05; ** for p<0.001).

