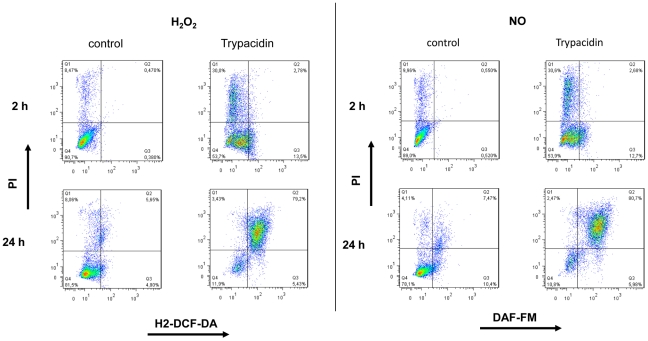
Figure 9. Flow cytometry analysis of H2O2 and NO related to PI staining.
A549 cells were seeded at 3×10⁴ cells/cm2 and cultured for 24 h. Then, cells were exposed to trypacidin 50 µM or DMSO 1% for 2 h and 24 h. H2O2 and NO production were measured using respectively H2-DCF-DA, and DAF-FM. IP was used to stain dead cells. Dot-blots are representative of three independent experiments.

