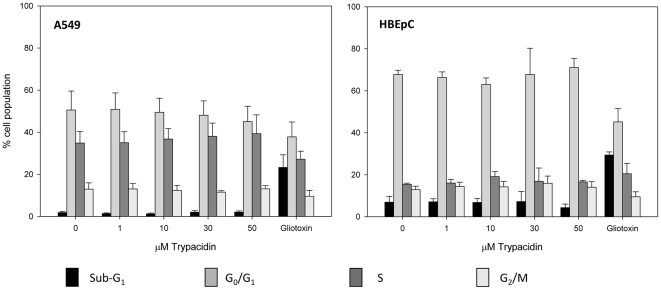
Figure 10. Flow cytometry analysis of the cell cycle.
A549 and HBEpC were exposed to 1, 10, 30 and 50 µM trypacidin for 24 h in culture conditions. In the negative control (0 µM trypacidin), cells were exposed to 1% DMSO. Gliotoxin 5 µM was used as positive control to induce sub-G1 particles. The cells were then harvested and analysed for cell cycle as described in the Materials and Methods. The figure shows mean values for 3 independent experiments.

