
Figure 11. Assessment of ΔΨm.
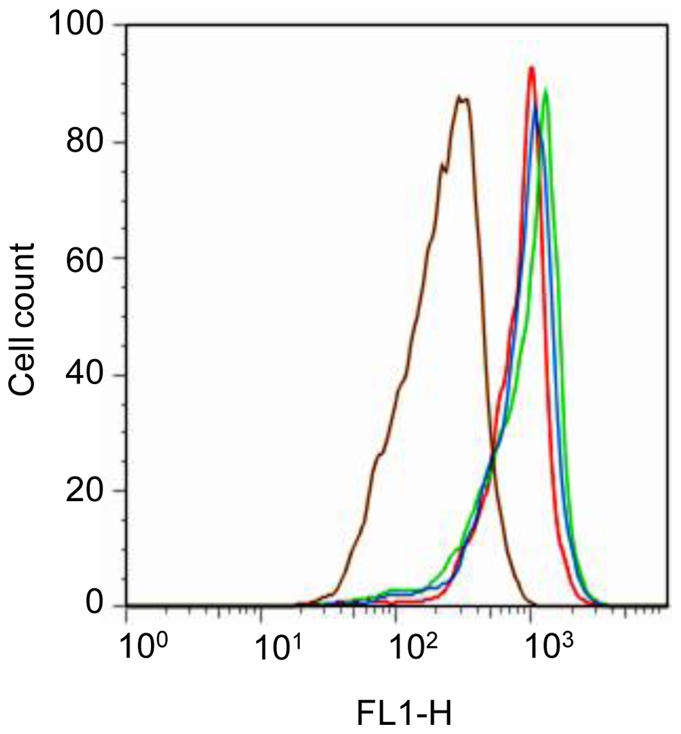
A549 cells were exposed 2 h or 24 h to 10 µM (green line) and 50 µM (blue line) trypacidin or with solely 1% DMSO as negative control (red line). After treatment, cells were stained with DiOC6 for 20 min. at 37°C. Cells incubated with 40 µM FCCP were used as positive control (brown line). The figure is representative of 3 independent experiments.