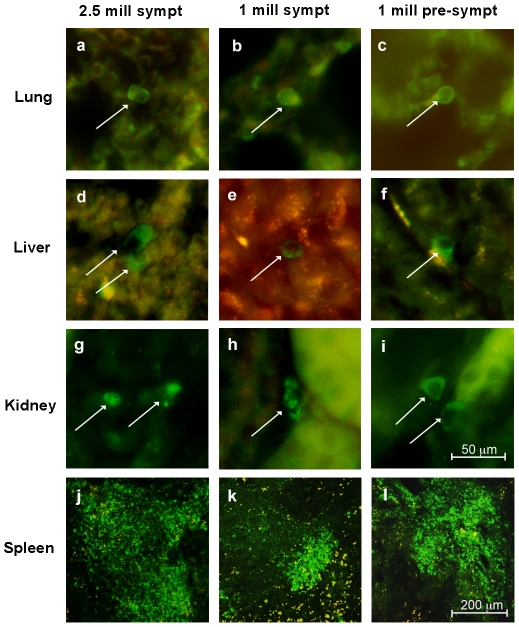
Figure 4. Distribution of MNC hUCB cells in the lung, liver, kidney and spleen of G93A mice.
MNC hUCB cells immunohistochemically positive for HuNu (green, arrows) were detected in the lung, liver, kidney, and spleen of mice receiving 2.5×10⁶ (a, d, g, j) or 1×10⁶ (b, e, h, k) cells symptomatically or 1×10⁶ cells pre-symptomatically (c, f, i, l). In the liver, lung and kidney, few cells were identified. In the spleen, a high density of HuNu cells was determined in all cell-treated mice (j–l). Scale bar: a–i is 50 µm; j–l is 200 µm.

