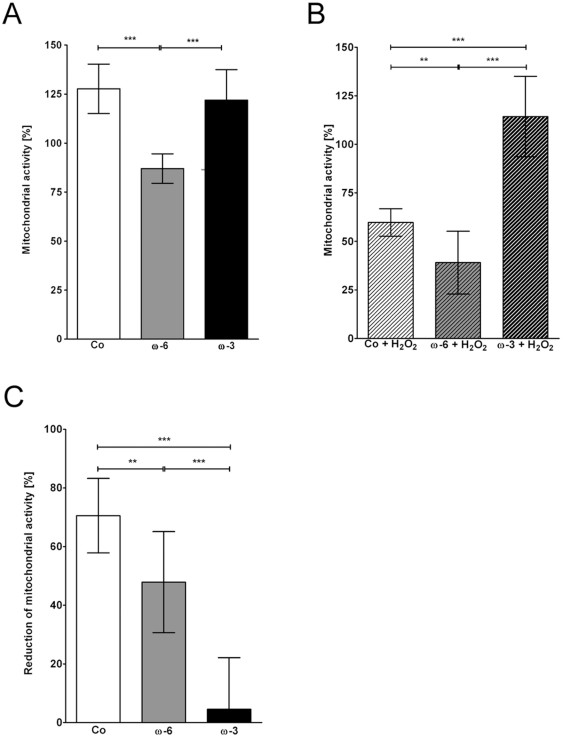
Figure 1. CCK-8 assay.
Quantification of mitochondrial activity in hTM after 48 hours normalized to starting activity in controls. (A) Effects of ω-6 (16 µM) and ω-3 (50 µM) fatty acids compared to controls (Co). (B) Effects of H2O2 in controls, ω-6 and ω-3 fatty acids pre-treated hTM. (C) %-reduction of mitochondrial activity after H2O2 exposition. Values represent mean averages (m.a.) ± standard deviations (sd) of three independent experiments performed in triplicates of 5 different donors (n = 45); asterisks: p-values of statistical significances (**p≤0.01; ***p≤0.001).

