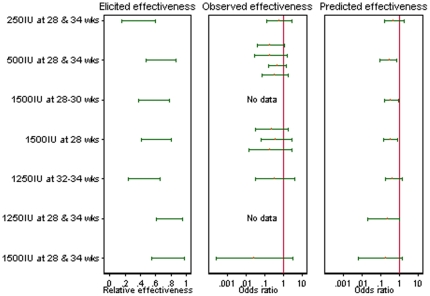
Figure 5. Exploratory analysis comparing different dose regimens.
For each of seven RAADP treatment regimens: elicited relative effectiveness compared to an optimally effective treatment (67% intervals pooled across assessors); observed odds ratios comparing RAADP to control (with 95% intervals), where available; and odds ratios expected in a future study comparing RAADP to control (with 95% intervals), obtained from a fitted meta-regression model. (Higher values for relative effectiveness compared to an optimal treatment correspond to lower odds ratios compared to control.).

