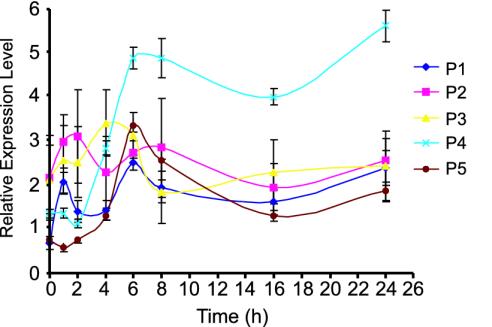
Fig. 3.
Gene expression pattern analysis. Five gene expression patterns were identified after a time course analysis of the KCl-induced genes. Pattern 4 represents the majority of the gene group (64.2%). The expression level of this group peaks at 6 h after KCl induction and is sustained for 24 h. The percentages of genes in the other four expression patterns are as follows: pattern 1, 6.2%; pattern 2, 2.8%; pattern 3, 2.1%; and pattern 5, 24.7%.

