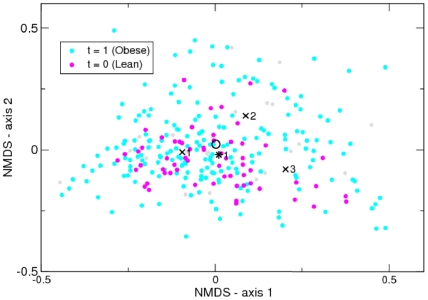
Figure 4. NMDS plot of Twins dataset with class labels.
Samples from Lean ( ) individuals are shown in magenta and Obese (
 ) in Cyan. Overweight are grey. The black crosses indicate the Dirichlet means of each component of the three components for the Obese class, the black asterisk the single component for the Lean class. We also show the posterior mean of the entire Obese class as a black circle.

