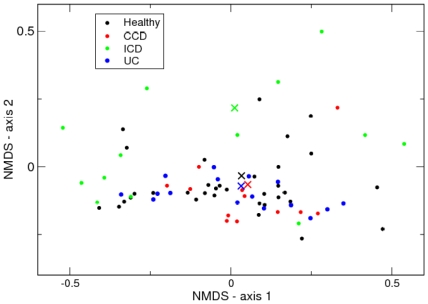
Figure 6. NMDS plot of IBD dataset with class labels.
Samples from Healthy individuals (black), and three IBD phenotypes, (red) colonic Crohn's disease (CCD), (green) ileal Crohn's disease (ICD), and (blue) ulcerative colitis (UC) are shown. The Dirichlet means of single component fits to each type are shown by the corresponding coloured cross.

