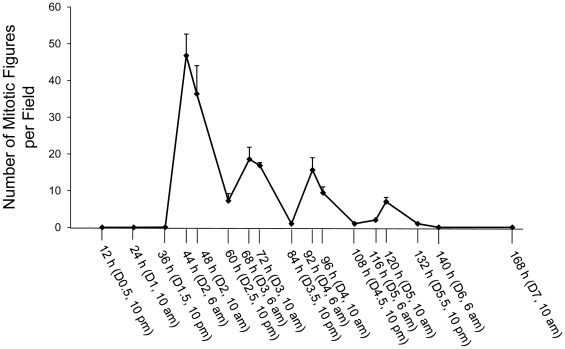
Figure 3. Dynamic of hepatocyte mitosis during partial hepatectomy (PH)-induced liver regeneration.
Mice were subjected to PH and sacrificed at the indicated time points. Hepatic mitotic figures were counted at 100× magnification in 5 randomly chosen fields per liver section stained with hematoxylin and eosin. The data are shown as means per field ± SD (n = 3 mice per time point).

