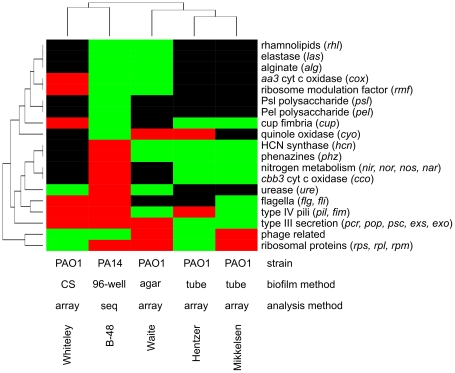
Figure 3. Comparison of differential regulation among different studies.
This qualitative ‘heatmap’ compares the differential expression of selected genes and gene clusters in B-48 with similar studies that have been published previously. In all cases, the expression of a biofilm culture was compared to a planktonic culture. The studies included in this analysis are Whiteley et al. [1], Waite et al. [21], Hentzer et al. [4] and Mikkelsen et al. [20]. The method abbreviations are CS – chemostat (continuous culture), 96-well – static 96-well plate cultures, agar – nitrocellulose filter on agar surface, tube – silicon tubes, array – DNA microarray analysis, seq – sequencing of cDNA.

