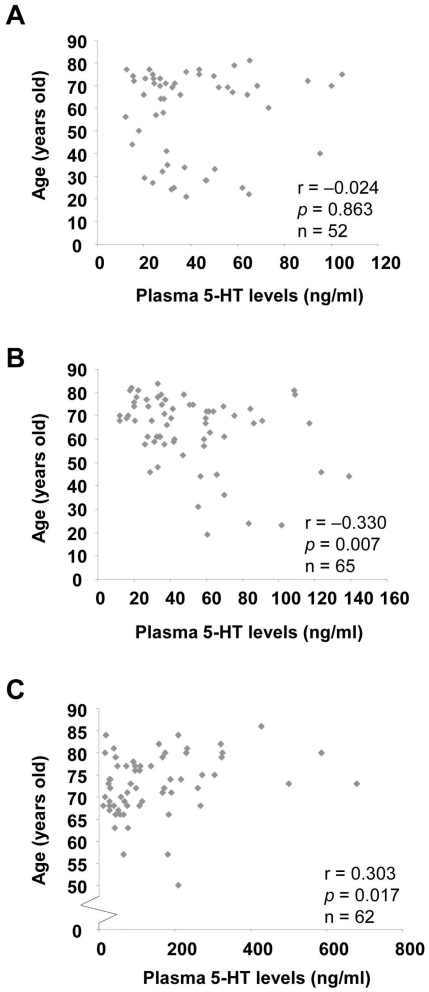
Figure 4. Spearman's correlation between plasma 5-HT levels and age in different groups.
The scatter plot of the relation between plasma 5-HT levels and age in healthy non-smokers (A), healthy ever-smokers (B) and COPD ever-smokers (C). The Spearman correlation coefficient (r) and the p value were shown.

