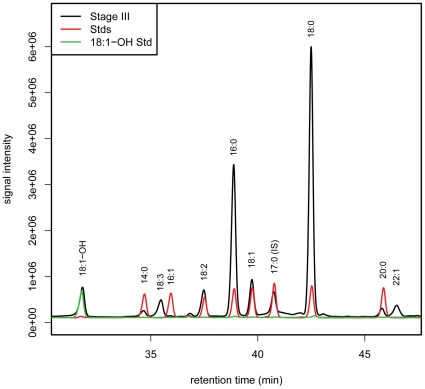
Figure 2. Acyl-CoA analysis of developing castor endosperm.
A chromatogram of fluorescent acyl-CoA derivatives from developing castor endosperm stage III is shown - dark trace. Results from analysis of synthesised 18:1-OH-CoA (green line) and other acyl-CoA standards (red trace) are superimposed to confirm the indicated peak identities in the endosperm sample.

