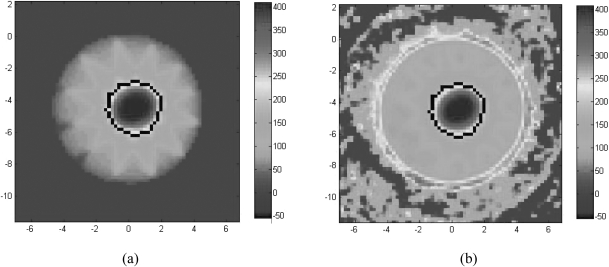
Figure 5.
An axial snapshot of the STATIC dose for Conf1 (c) and the dose measured by Conf1 (d). The dose comparisons between the STATIC distribution and the distribution measured by the control gels were performed in the volume enclosed by the 200 cGy isodose surface on the STATIC dose map, which is outlined in black in (a) and (b).

