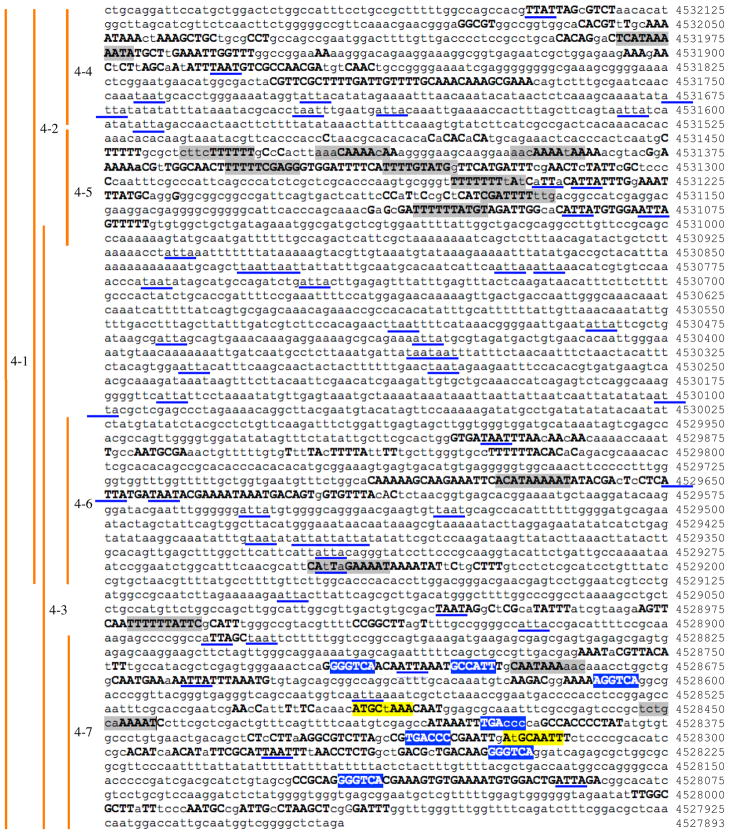
Fig. 2.
Evoprint of the cis-regulatory DNA used in this study. Bold capital letters represent conservation in either all 12 or 11/12 Drosophila species for which genomic data exists. The Flybase coordinates for the first nucleotide of each row is shown to the right, and the approximate positions of the constructs used is shown to the left (see methods for exact location of these constructs). Transcription factor predicted binding sites within the conserved blocks of DNA were determined using the TESS website (http://www.cbil.upenn.edu/cgi-bin/tess). Blue, Seven-up (Svp) binding sites; gray, Hb binding sites; yellow, Pou domain binding sites, including Nubbin/Pdm2; blue underlines, homeodomain core motifs (ATTA/TAAT) sites.

