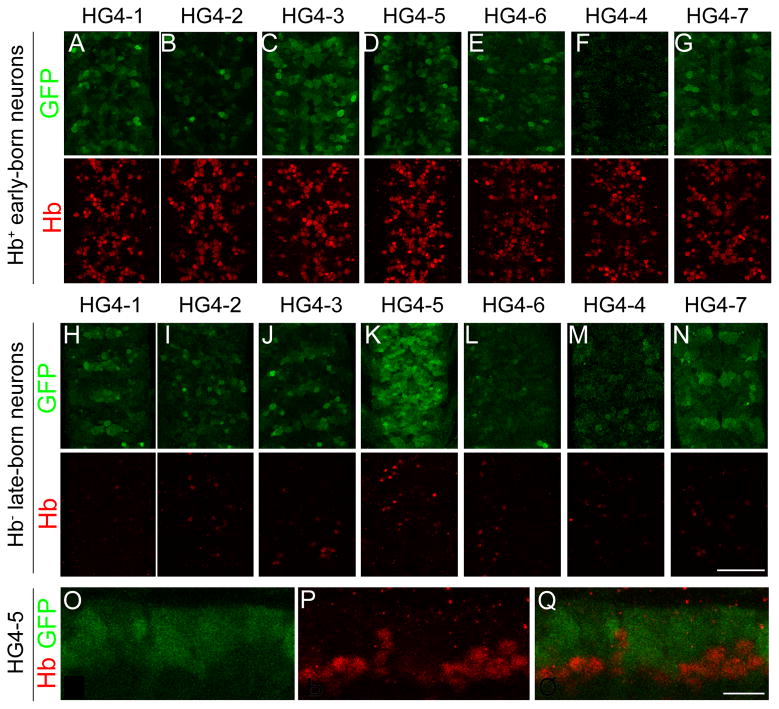
Fig. 6.
Expression of the endogenous hunchback gene (hb) and enhancer-reporter transgenes (HG series) in the stage 16 CNS. Confocal images of the CNS stained for HG reporter construct patterns (GFP, green) and endogenous Hb protein (red). (A–G) Ventral view of deep layer, early-born, Hb+ neurons. Lines HG4-1, HG4-2, HG4-3, HG4-5 and HG4-6 show expression in these Hb+ neurons. (H–N) Ventral view of superficial layer, late-born, Hb-negative neurons. Only line HG4-5 shows strong expression in these Hb-negative neurons; other lines show scattered expression (HG4-1, HG4- 2, HG4-3) or high background due to increasing the confocal gain to try and detect expression (HG4- 4, HG4-6, HG4-7). For A–N, two segments are shown, determined by Engrailed staining in the fourth confocal channel (not shown). (O–Q) Lateral view of a stage 16 CNS showing HG4-5 expression in superficial neurons (O, Q; green GFP staining) and almost no expression in Hb+ deep layer neurons (P, Q; red endogenous Hb staining). Scale bar is 50 μm in A–N, and 10 μm in O–Q.

