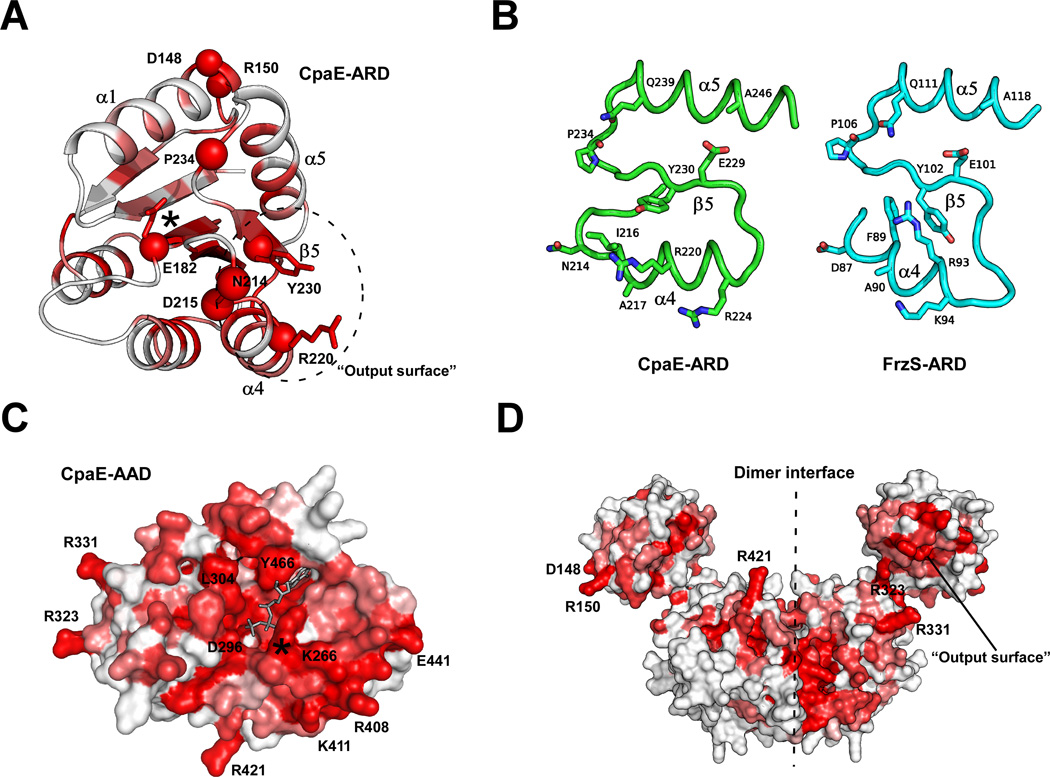
Fig. 8.
Homology modeling of CcTadZ (CpaE) and mapping of conserved residues. (A) Homology model of the CcTadZ ARD domain colored by sequence conservation in a gradient from the non-conserved (white) to the most conserved (red). The Cα atoms of the most conserved residues are shown in red spheres. (B) Comparison of the “output surface” of the ARD domains of CcTadZ and FrzS. (C) Surface representation of the homology model of the AAD of CcTadZ colored by sequence conservation (color scheme same as A). ATP is shown as grey sticks. The P-loop region is denoted by a star. (D) A CcTadZ dimer model based on the ErTadZ dimer (color scheme same as A).

