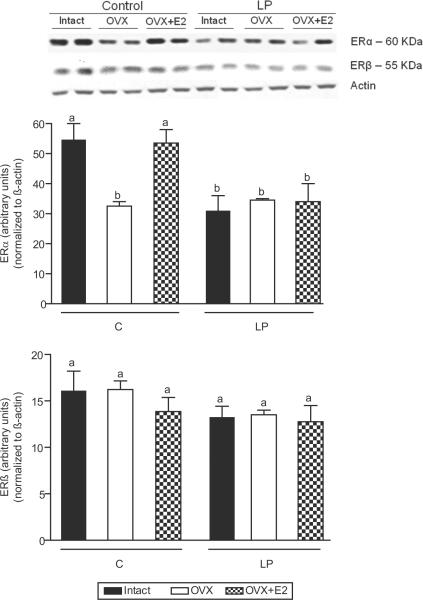
Figure 5.
Vascular protein levels of ERα (A) and ERβ (B) receptors in intact, ovariectomized (OVX), and E2 replaced (OVX +E2) control and protein restricted offspring at 16 weeks of age. The top panel shows representative blots of ERα and ERβ proteins and β-actin; the bottom panel is the summary of densitometry results of 5–6 animals in each group. Results were normalized against β-actin and expressed in arbitrary units. Data are expressed as mean ± SEM. Bars with different letter superscripts differ significantly (P<0.05).

