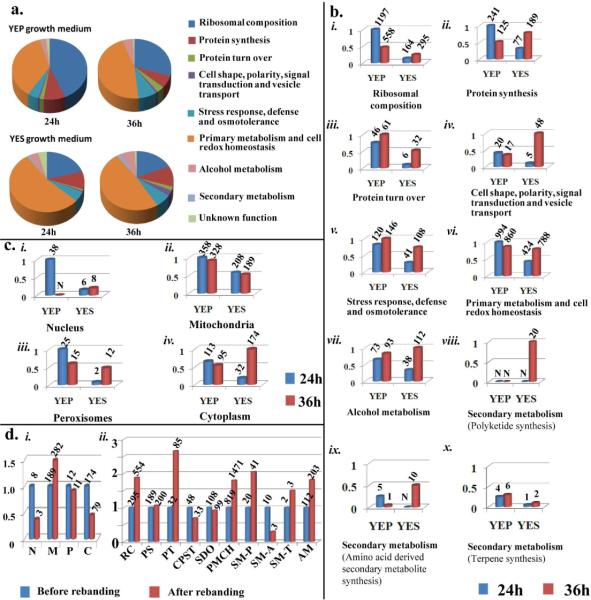
Figure 1. Analysis of the A. parasiticus vesicle-vacuole (V fraction) proteome.
A. parasiticus was cultured under standard growth conditions for 24 or 36 h under aflatoxin inducing (YES) or non-inducing (YEP) conditions (see Methods). V - fraction was purified from mycelial samples and high throughput LC/MS/MS conducted. a. Relative distribution of predicted protein functions in the V proteome. Peptides identified by LC/MS/MS analysis were matched to specific proteins in the A. flavus genome using Scaffold v3.08 software. Each unique protein was assigned to a cellular function category by Scaffold as illustrated by color-codes in the pie chart. b. The relative number of peptides that matched A. flavus proteins in each functional category as observed in (a). c. The relative number of peptides that match A. flavus proteins that function in specific sub-cellular organelles based on studies conducted in filamentous fungi or other biological models. d. Effect of “rebanding” on the V proteome of A. parasiticus grown in YES for 36h: i) The relative number of peptides functionally linked to specific sub-cellular organelles (see c). Abbreviations: N, nucleus; M, mitochondria; P, peroxisomes; C, cytoplasm. ii) The relative number of peptides assigned to functional groups as described in (b). Abbreviations: RC, ribosomal composition; PS, protein synthesis; PT, protein turn over; CPST, cell shape, polarity, signal transduction and vesicle transport; SDO, stress response, defense and osmoregulation; PMCH, primary metabolism and cell redox homeostasis; SM-P, polyketides; SM-A, amino acid-derived secondary metabolites; SM-T, terpenes; AM, alcohol metabolism. The entire analysis was performed on two biological replicates with similar results. Numbers on bars in figures (b), (c) and (d) represent the number of the peptides observed in a single experiment. Only peptide matches reported with a 95% confidence level were considered in this analysis. The false discovery rate (FDR) for these analyses was 0.2%.

