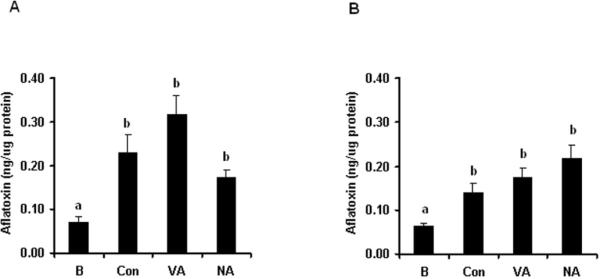
Figure 2. Aflatoxin intermediate feeding experiments.

A. parasiticus SU-1 was cultured in 100 ml of YES liquid medium for 36 h under standard growth conditions and a vesicle/vacuole (V) fraction and a non-vesicle/vacuole (NV) fraction were purified. VA and NA were fed to the V or NV fraction for 16 h (see Methods). (A) Feeding VA or NA to V fraction. (B) Feeding VA or NA to NV fraction. Bar designations on graphs: B, sample analyzed immediately without feeding and without incubation; Con, sample without feeding and incubated for 16 h; VA, NA, samples fed with versicolorin A or norsolorinic acid, respectively and incubated for 16 h. Aflatoxin concentration was measured in triplicate in each experiment. Feeding experiments of V and NV fractions were repeated 3 times with similar trends. Statistical analysis was performed using Student's t-test. Bars labeled with different lower case letters specify a statistically significant difference between two measurements. Similar lower case letters indicate no statistically significant difference between two measurements. P values (compared to B sample) are as follows: Con (P=0.020), VA (P=0.006), NA (P=0.007) in panel A; Con (P=0.015), VA (P=0.009), NA (P=0.008) in panel B.
