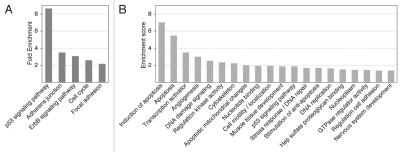
Figure 8.
DAVID functional annotation analysis of the genes associated with high-confidence p53 ChIP-seq peaks in IMR90 cells. (A) Most highly enriched KEGG pathways (p-value < 0.01). Fold enrichment is shown as calculated by DAVID. (B) Most highly enriched clusters of genes with enrichment score above 1.3. See Table S10 for all enriched clusters.

