
Figure 5.
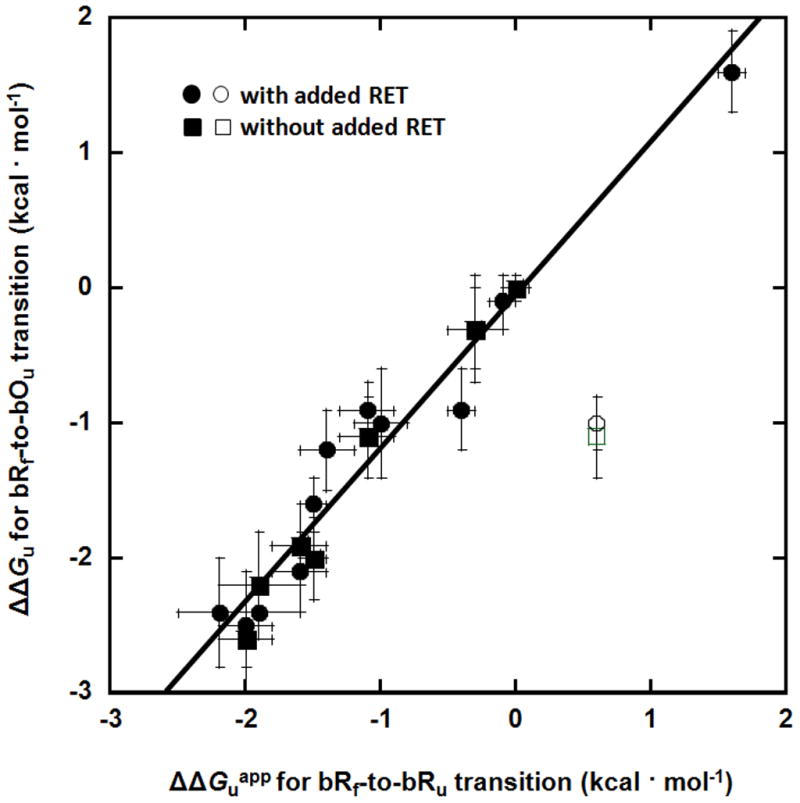
Correlation between ΔΔGuapp values measured for the bRf-to-bRu transition and the ΔΔGu values measured for the bRf-to-bOu transition. Square symbols refer to values measured without added RET and circle symbols refer to values measured with added RET. The open symbols refer to values for the P50A mutation, which is an outlier. The least squares fit line through all the filled symbols has a slope of 0.98 ± 0.07 and an intercept of −0.01 ± 0.12 kcal mol−1. The correlation coefficient is 0.96.