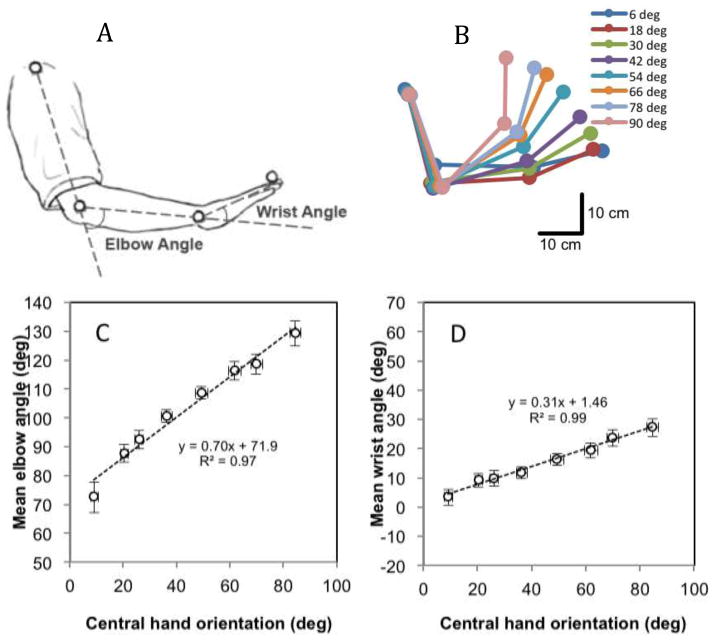
Figure 1.
Biomechanical data from the visual surface matching task. The upper left panel (A) illustrates the VICON markers (drawn to scale) attached to the hand and arm, and defines the elbow and wrist angles. The upper right panel (B) shows the average arm postures of all participants in the visual surface orientation matching task. Each set of four dots of the same color represent the VICON markers. Different colors represent different visual slant conditions. In the lower panels, the mean elbow angle (C) and mean wrist angle (D) are plotted as functions of mean central hand orientation for the visual surface orientation matching task. Standard errors of the means are shown.

