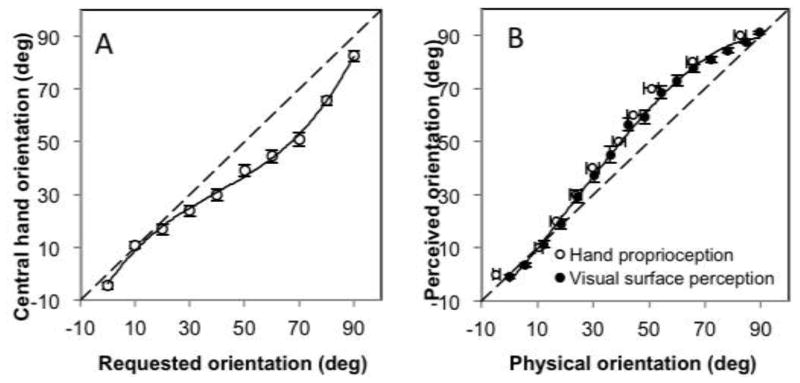
Figure 4.
Orientation production data. A. Mean central hand orientation plotted as a function of the indicated orientation for the orientation production task. A polynomial fit (cubic) is shown. B. Comparison between visually perceived surface orientation (solid circles; estimation data from Durgin, Li and Hajnal 2010; Experiment 1) and proprioceptively perceived (verbally requested) hand pitch orientation (open circles). A polynomial (cubic) fit of the visually perceived slant is shown. Standard errors of the means are shown.

