Figure 4.
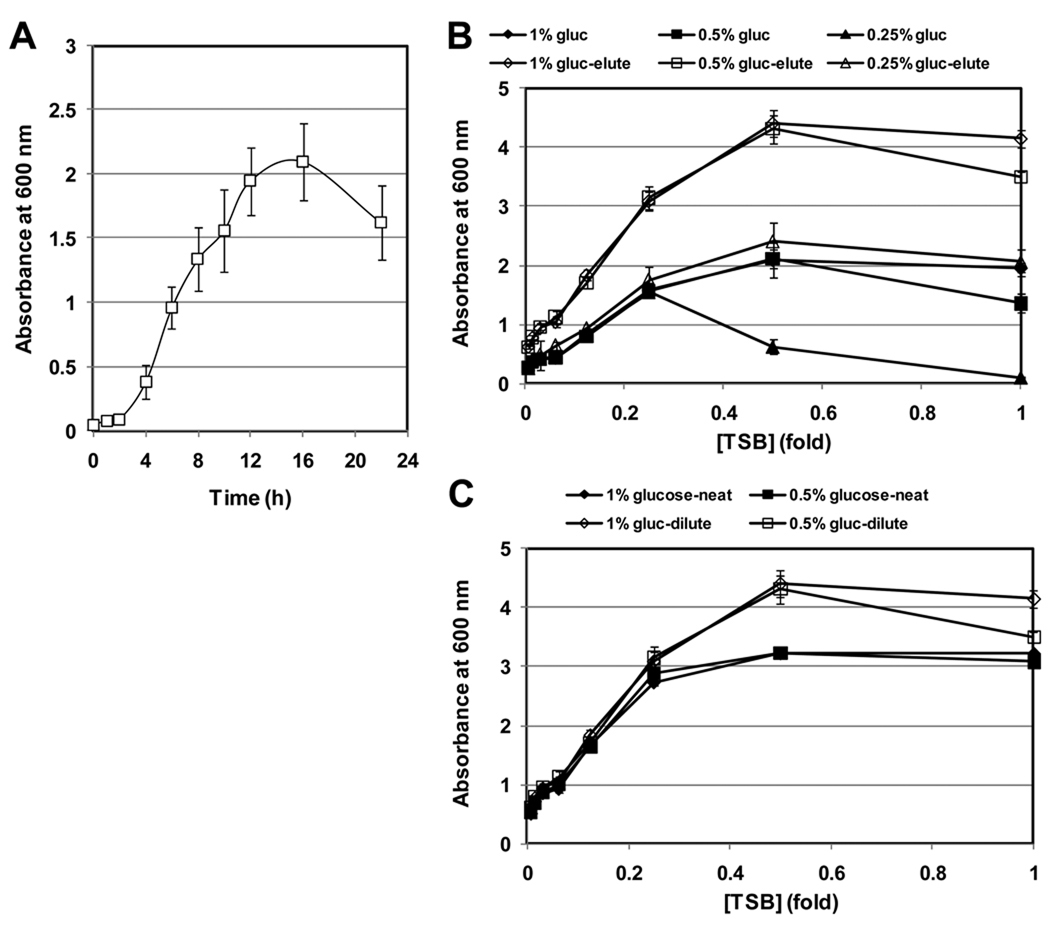
Optimization of assay conditions. A) A biofilm growth curve of S. aureus ATCC 35556 grown in 0.5X TSB supplemented with 1% glucose. B) Biofilms were grown in varying media conditions to identify optimal growth conditions and two methods of biofilm detection are compared. Biofilms were grown at 37 °C for 18 h. Biofilms were stained as described above and the amount of crystal violet bound to the bottom of each assay well was measured directly as absorbance at 600 nm, or crystal violet was eluted from each well, diluted 1:10, and the absorbance at 600 nm was measured. C) Comparison of absorbance at 600 nm readings of neat vs. a 1:10 dilution of eluted crystal violet demonstrates the linear range of the assay.

