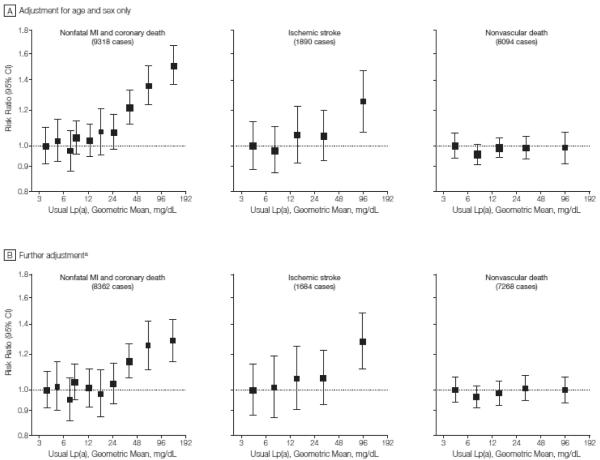
Figure 2. Risk Ratios for Coronary Heart Disease, Ischemic Stroke, or Nonvascular Death by Quantile of Usual Lp(a) Level.
Lp(a) indicates lipoprotein(a); MI myocardial infarction. Sizes of data markers are proportional to the inverse of the variance of the risk ratios. Confidence Intervals (CIs) were calculated using a floating absolute risk technique. Studies involving fewer than 10 cases of any outcome were excluded from the analysis of ttiat outcome.
aFurther adjustment for usual levels of systolic blood pressure, smoking status, history of diabetes, body mass index, and total cholesterol. The x- and y-axes are shown on a log scale. Lowest quantiles are referents.

