
Fig. 3.
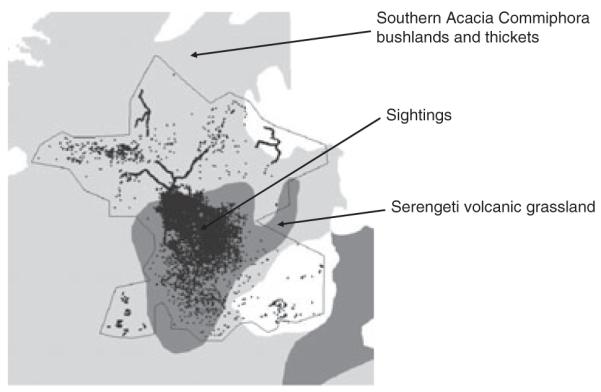
Distribution of the carnivore sightings in the study area (small circles) plotted against the main ecoregions in the study area.
Official websites use .gov
A
.gov website belongs to an official
government organization in the United States.
Secure .gov websites use HTTPS
A lock (
) or https:// means you've safely
connected to the .gov website. Share sensitive
information only on official, secure websites.
Distribution of the carnivore sightings in the study area (small circles) plotted against the main ecoregions in the study area.