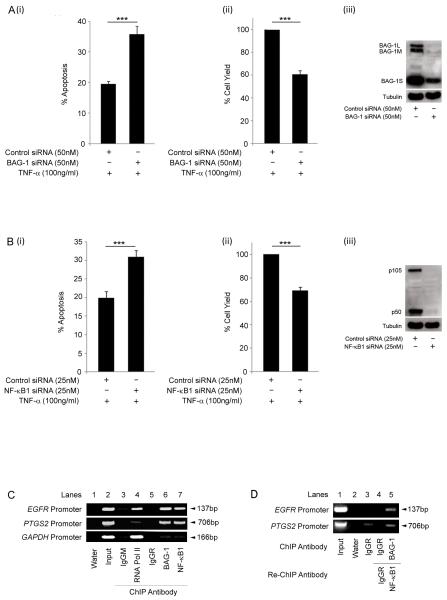
Figure 4. BAG-1 and NF-κB1 promote cell survival in HCT116 cells.
HCT116 cells were transfected with (A) control negative / BAG-1 or (B) control negative / NF-κB1 siRNA; suppression of protein expression was confirmed by Western analysis (iii). Cells were treated with TNF-α (100ng/ml) for 16h and apoptosis (i) and attached cell yield (ii) assessed. The results shown are the mean of three independent experiments done in triplicate (± standard deviation). Statistical analysis was carried out using a Student’s t-test * = P < 0.05; ** = P < 0.01; *** = P < 0.001. BAG-1 and p50 are present at the same binding site on the EGFR and PTGS2 promoters. (C) ChIP analysis of the EGFR, PTGS2 and GAPDH promoters in HCT116 cells using antibodies to immunoprecipitate the indicated proteins. The IgGM and IgGR antbodies are used as negative controls for non-specific binding of the antibody to the chromatin fragments. Results are representative of four independent experiments. p50 and BAG-1 are part of the same DNA complex at gene promoters. (D) Re-ChIP analysis of the EGFR and PTGS2 promoters in the HCT116 cell line using the indicated combination of antibodies.

