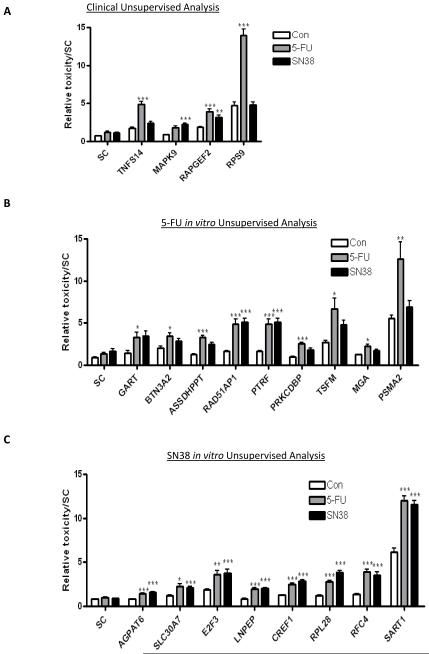
Figure 2.
Results from the initial siRNA screen in the HCT116 cells. The graphs show the relative toxicity, as assessed from MTT and toxilight assays, for all positive genes from the: (A) clinical analysis, (B) the 5-FU in vitro analysis, and (C) the SN38 in vitro analysis. Displayed are those genes that show an interaction between gene silencing and either 5-FU or SN38 treatment as measured by 2-way ANOVA. Synergistic interactions are highlighted as *=p<0.05, **=p<0.01 and ***=p<0.001.

