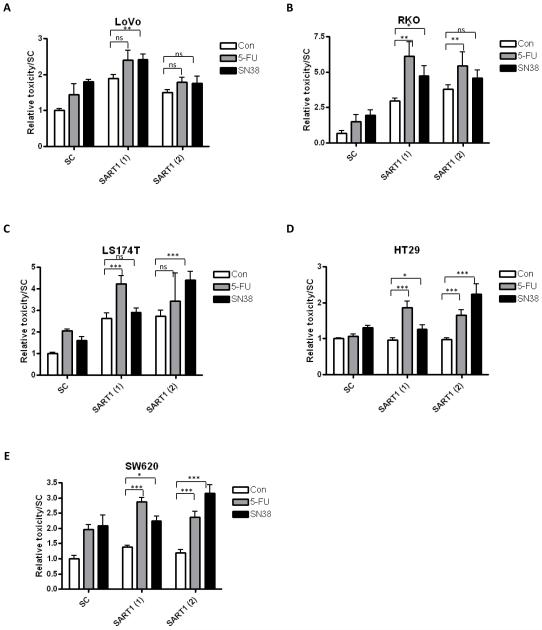
Figure 3.
Results from the cell line panel siRNA screen. The graphs show the relative toxicity, as assessed from MTT and toxilight assays, for SART1, PTRF and RAPGEF2 for the (A) LoVo, (B) RKO (C) LS174T, (D) HT29, (E) SW620 cell lines. Displayed is the effect of gene silencing alone and in combination with either 5-FU or SN38 treatment. Statistical significance between gene silencing alone (siRNA) and gene silencing in combination with chemotherapy are assessed by an unpaired 2 way t test. statistical significance are highlighted as *=p<0.05, **=p<0.01 and ***=p<0.001. Two siRNA sequences were included for each gene, indicated by (1) and (2).

