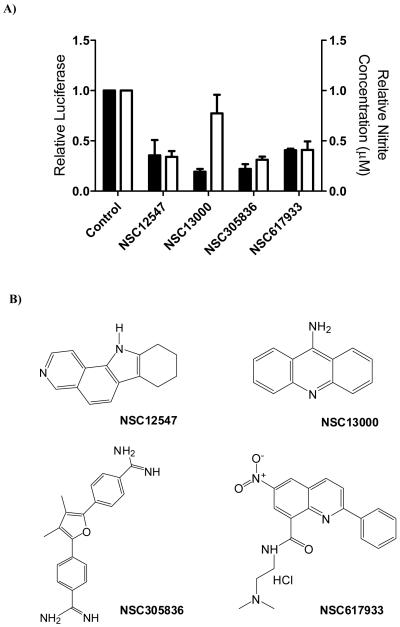
Figure 4.
A; solid bars, NFκB activity in MDA-MB-468 cells treated with 100μM NRH and 20mg/ml TNFα plus a variety of the NSC compounds at a concentration of 100nM; open bars, effects of the NQO2 inhibitors (125nM) on nitrite production by J774.2 cells treated with LPS and IFNχ. B; structures of the compounds used to generate the data in panel A.

