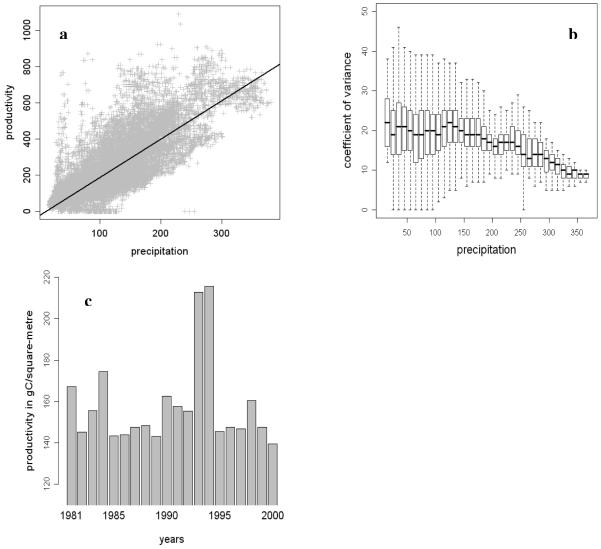
Fig. 1. Trends in productivity data for the northern Gobi.
1a: Regression plot between the modelled mean annual precipitation and the estimated mean productivity (in gC/square metre, computed over the years from 1981-2000). The black line represents the linear model (r2 =0.66)
1b: Coefficients of variance (of the net primary production, computed for 1981-2000) plotted against the averaged precipitation, which is pooled within 10 mm/a intervals
1c: Changes in mean annual mean net primary production from 1981 to 2000

