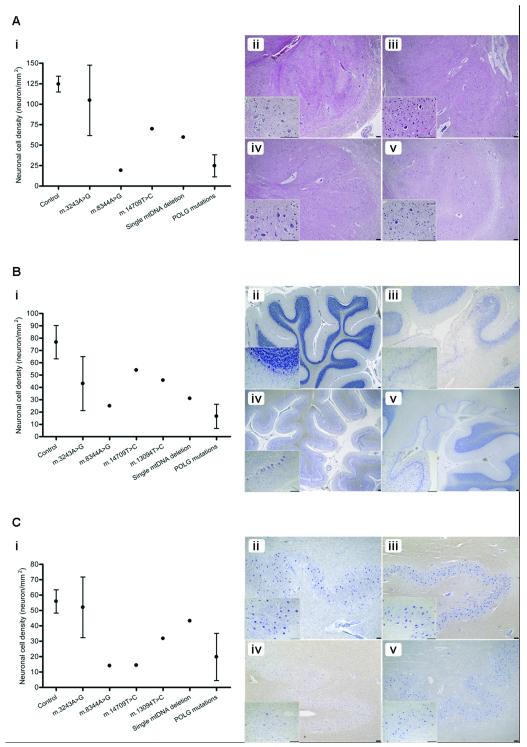
Figure 2.
Variation in neuron loss across the olivo-cerebellum in patients with mitochondrial DNA (mtDNA) mutations. (A) Inferior olivary neuronal densities vary remarkably according to the mtDNA defect vs. control tissues (n = 2) (i). Cell loss is most severe in association with the m.8344A>G (iii; H&E) and recessive POLG (iv; H&E) mutations with only moderate loss associated with the m.14709T>C mutation (v; H&E) vs. control tissues (ii; H&E). (B) Purkinje cell density is reduced in all patients with mtDNA defects vs. controls (n = 5) (i). This is most apparent in a patient with POLG mutations in which neuron loss is global and with the presence of microinfarcts (v; cresyl fast violet [CFV)]). Atrophy of the cerebellar cortex is severe in m.3243A>G (iv; CFV) and Purkinje cell loss often occurs focally in microinfarcts (iii; CFV) when compared to control tissue (ii; CFV). (C) Neuronal cell density in the dentate nucleus also shows wide variation in patients relative to controls (n = 8) (i). Typically, patients with the m.3243A>G mutation show preservation of neurons (iii; CFV) vs. control tissue (ii; CFV); cell loss is severe in m.8344A>G (iv; CFV), and minimal in single mtDNA deletion patients (v; CFV). Scale bar: 100 μm.

