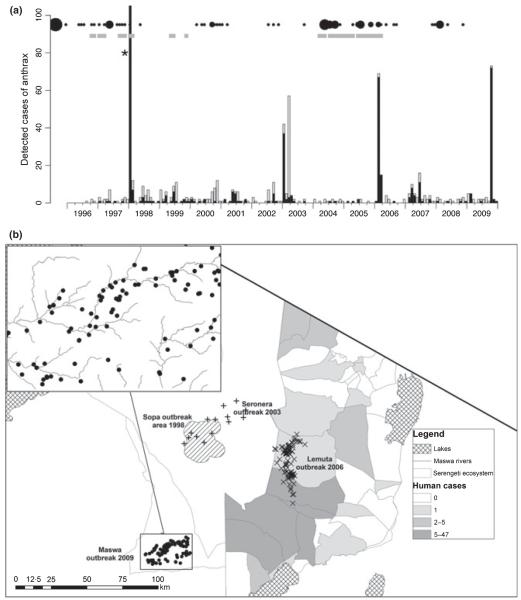
Fig. 1.
Spatiotemporal patterns of anthrax infection in the Serengeti ecosystem. (a) Time series showing continuous detection of small numbers of cases in wildlife, interspersed with occasional large outbreaks. Probable cases are shown in black and suspect cases in grey. *549 ‘probable’ and 67 ‘suspect’ cases were detected. Black circles indicate hospital records, scaled according to numbers and gray squares indicate when livestock cases were reported (data quality too poor to quantify). (b) Spatial location of cases, showing outbreak areas. Villages shaded according to hospital reports from 1995 to 2008. Exact locations of carcasses retrieved during the 1998 (Sopa) outbreak were unavailable, so the shaded area demarcates the outbreak area. For the 2003 outbreak (crosses – Seronera), the locations of cases are randomized within a 10 km radius of the outbreak area, because exact locations were not available. Inset shows the location of buffalo carcasses during the 2009 outbreak in Maswa district. LGCA, Loliondo Game Control Area; NCA, Ngorongoro Conservation Area; SNP, Serengeti National Park.

