Fig. 5.

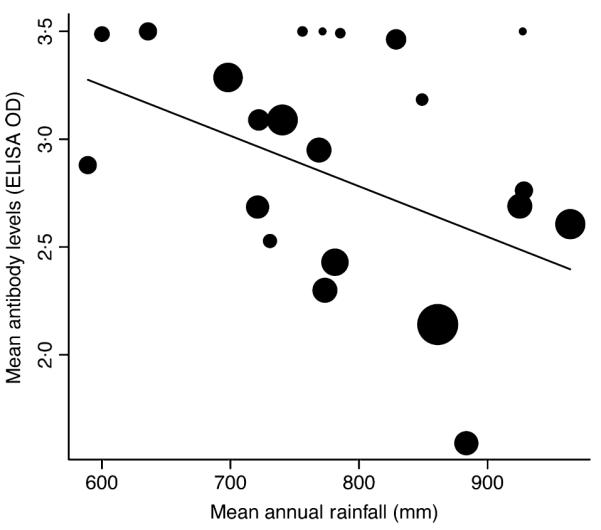
Mean annual antibody levels in Serengeti lions vs. mean annual rainfall. The symbol size reflects the number of lions sampled and the line indicates the best fitting regression (R2 = 0.21, correlation coefficient =− 0.002, n = 20, P = 0.03).

Mean annual antibody levels in Serengeti lions vs. mean annual rainfall. The symbol size reflects the number of lions sampled and the line indicates the best fitting regression (R2 = 0.21, correlation coefficient =− 0.002, n = 20, P = 0.03).