
Fig. 3.
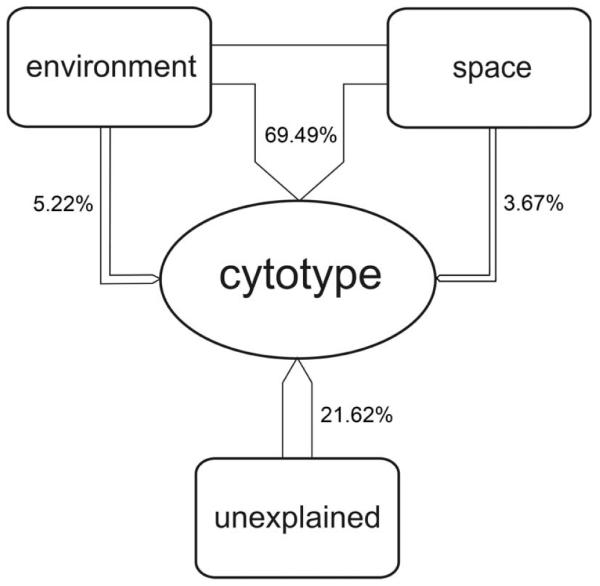
Schematic representation of the partitioning of variance in the distribution of the cytotypes of Senecio carniolicus within the study plot on Mt Hoher Sadnig, Carinthia, Austria, following Borcard (1992), see text for further details. The two predictors, “environment” and “space” are represented by the NMDS– and PCNM-axes, respectively.