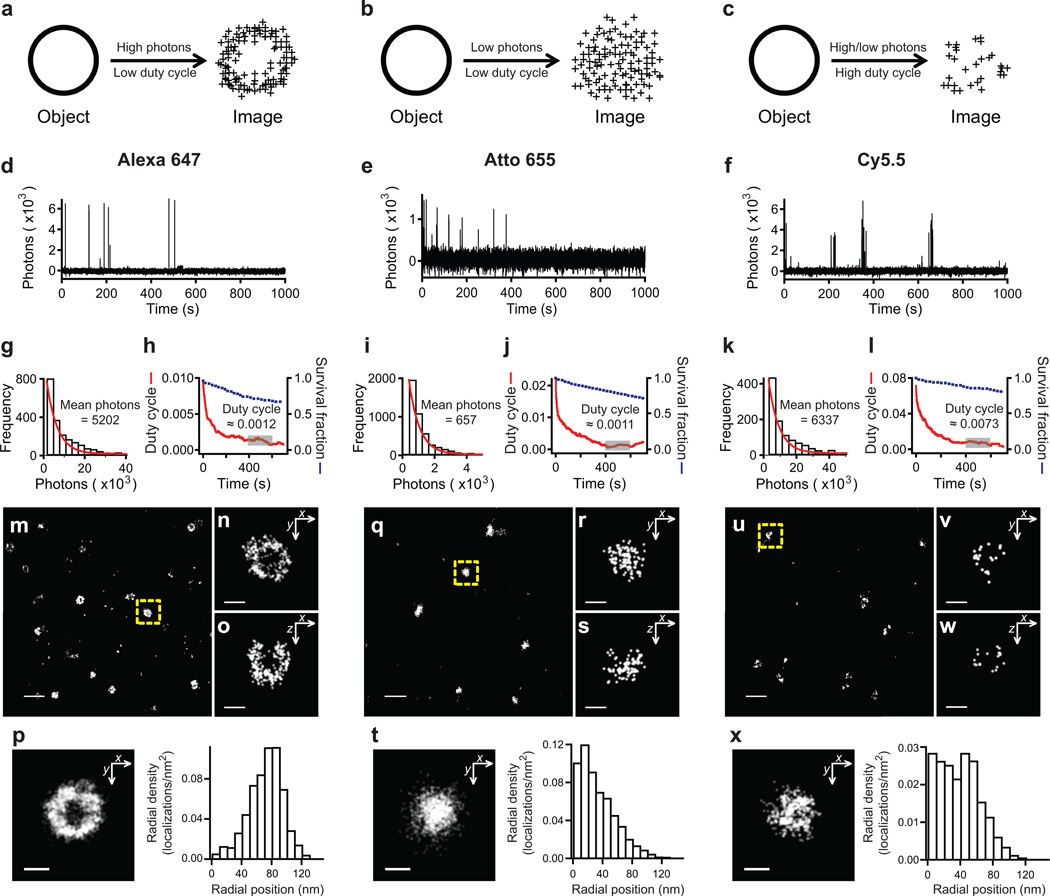
Figure 2. Quantitative probe characterization for STORM imaging.
(a–c) The effect of number of detected photons per on-switching event and the on/off duty cycle (fraction of time in the on state) on STORM image quality for an example structure (a ring-like object). (a) A fluorophore with high photon number and low duty cycle produces a hollow, ring-like image with high localization precision and sufficient density. (b) A fluorophore with low photon number and low duty cycle maintains a large number of localizations, but suffers reduced localization accuracy, obscuring the ring-like structure. (c) A fluorophore with high on/off duty cycle requires reduction in the density of fluorescent probes to allow single-molecule localization, which in turn reduces the number of localizations and adversely affects the overall resolution. Single-molecule fluorescence time traces measured in the presence of βME and an oxygen scavenging system, as shown for three red-absorbing dyes (d) Alexa 647, (e) Atto 655, and (f) Cy5.5. Each of these dyes represents one of the scenarios described in (a–c). From these traces, the number of detected photons was determined for each switching event and a histogram was constructed from many events from hundreds of molecules (g,i,k). The indicated mean value was derived from the single exponential fit of the distribution (red curve). The on/off duty cycle value was calculated for each dye and plotted versus time (red curve; h,j,l) to show how each value begins high when most molecules are in the fluorescent state and reaches a quasi-equilibrium at a later time. The reported values are the average duty cycle measured between 400–600 sec (gray box). The fraction of molecules that survived photobleaching was plotted together with the duty cycle (blue squares). Images of clathrin-coated pits (CCPs) in 3D using the three dyes. (m–p) Alexa 647, (q–t) Atto 655, and (u–x) Cy5.5. The large fields of view shown in (m,q,u) are 2D projection images. The images of the CCPs indicated by the yellow dashed boxes are magnified and their xy cross-sections (n,r,v) and xz cross-sections (o,s,w) are shown. The composite xy cross-sections for ten CCPs aligned to their respective centers of mass are shown along with the radial density distributions of localizations derived from the composite xy cross-sections (p,t,x). Scale bars are 500 nm for (m,q,u) and 100 nm for (n–p, r–t, v–x).

