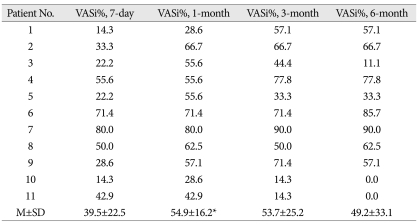
Table 2.
Degrees of visual analogue scale (VAS) improvement and their changes according to the time duration after radiofrequency neurotomy
*p<0.05, compared with the degree of VASi at 7 days after radiofrequency neurotomy (paired t-test). VASi% : degree (%) of VAS score improvement comparing to the pre-VAS

