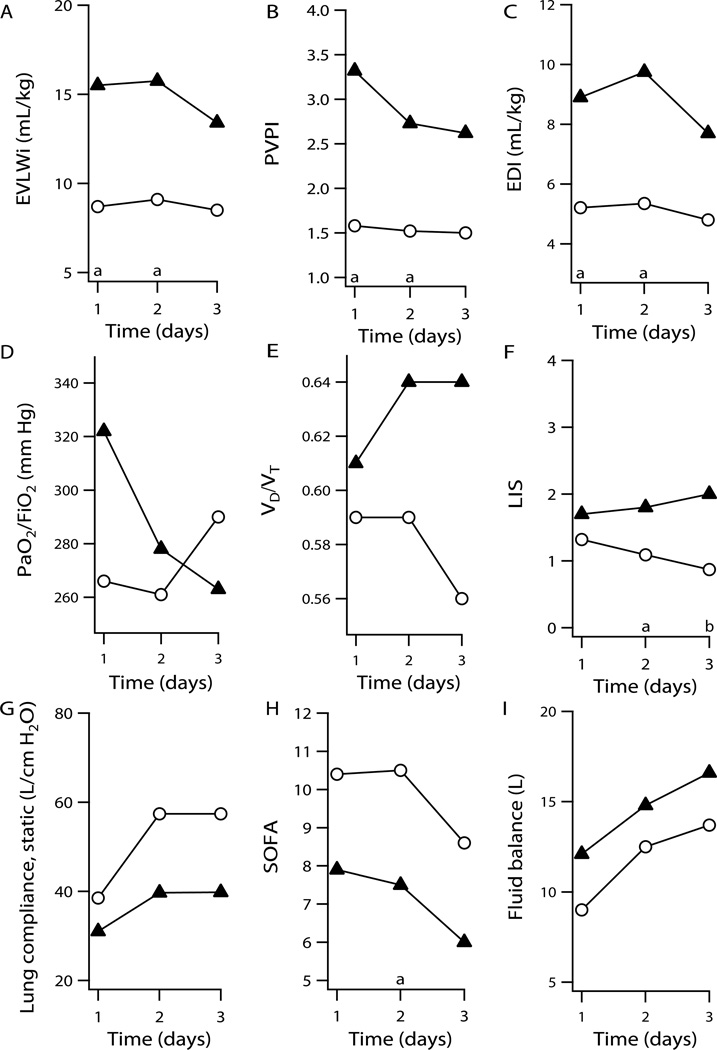
Figure 1.
Plots show mean values versus time over the first three days for patients who developed ALI (▲) and did not develop ALI (○). Plots show means versus time for A, EVLWi, B, PVPI, C, EDI, D, PaO2/FiO2, E, VD/VT, F, Murray lung injury score, G, static lung compliance, H, Sequential organ failure score, I, daily fluid balance, respectively. Statistically significant differences between those who developed ALI and those who did not are noted. Probabilities of <0.05 and <0.01 are designated by a and b respectively at foot of each graph.

