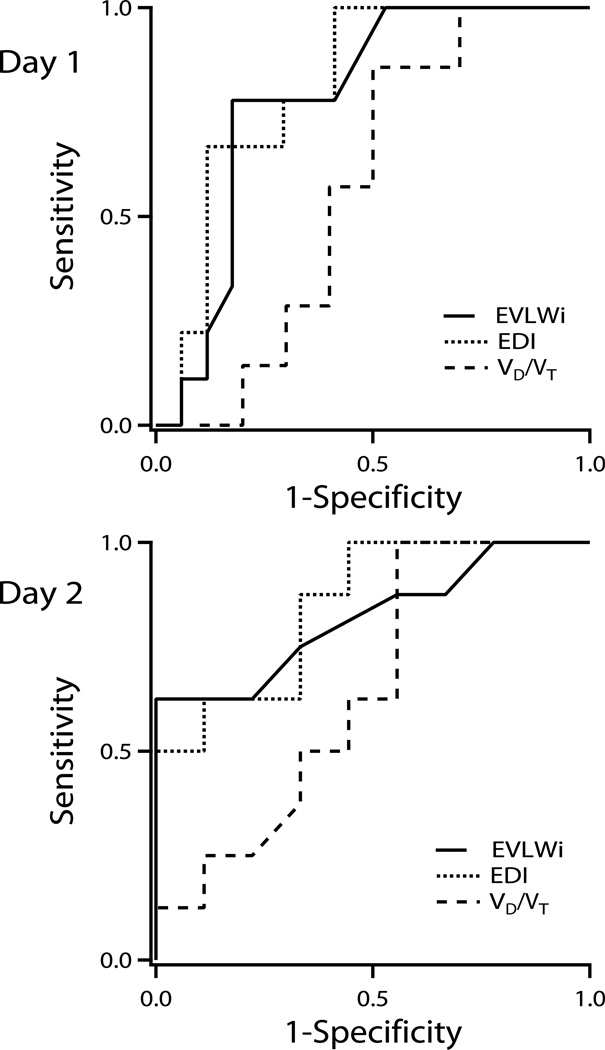
Figure 3.
Receiver operator characteristic curves for extravascular lung water indexed for predicted body weight (EVLWi), extravascular lung water – dead space tidal volume fraction (EDI), and dead space-tidal volume fraction (VD/VT) on days 1 and 2. For day 1, the areas under the curves were 0.75 ± 0.13, 0.77 ± 0.12, and 0.57 ± 0.14 for EVLWi, EDI, and VD/VT, respectively. For day 2, the areas under the curves were 0.82 ± 0.11, 0.85 ± 0.09, and 0.65 ± 0.14 for EVLWi, EDI, and VD/VT, respectively.

