
Figure 4. ANCOVA for VLs measured over time for AHBV-ALF and the overall CHBV-ALF groups adjusting for baseline IgM anti-HBc levels.
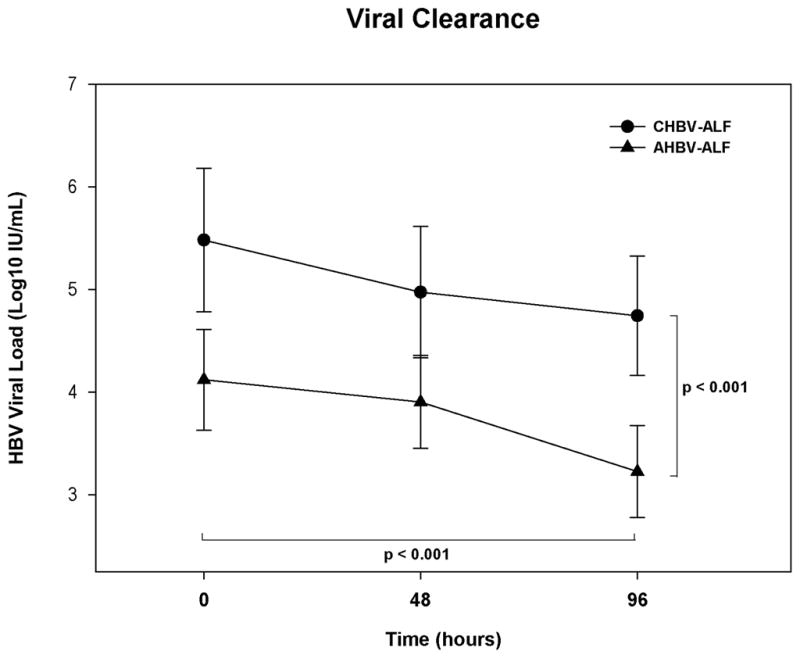
The decrease in VLs was significant for each of the two groups (p<0.001). VLs in AHBV-ALFs were consistently lower than in CHBV-ALFs at all time points (p<0.001). Admission IgM anti-HBc level was the only covariate that remained significant in the ANCOVA model (p=0.137). Error bars are 95% confidence intervals.